
The main differences between a company’s income and cash flow statements are timing issues but over time, cumulative net income should equal cumulative free cash flow. If free cash flow is consistently less than net income, it may indicate deteriorating earnings quality and since investors pay many multiples of annual earnings, the quality of earnings is paramount. Nowhere is this more relevant today than the reported earnings of the large (and well-owned) technology companies.
Capital Expenditure (cash flow statement) is the amount paid for property, plant & equipment whereas the Depreciation expense (income statement) is the spreading of this cost over its estimated useful life. The smoothed nature of depreciation and the often “lumpy” nature of capital expenditure (capex) means timing differences often occur. But since today’s capex will be tomorrow’s depreciation charge, analysing capex can provide insight into the future direction of expenses. If depreciation is consistently below capex, accounting earnings may well be overstating the truth.
To illustrate my point, look at Facebook’s numbers below.
In 2018 Facebook reported a $4.3bn depreciation expense, but the actual amount spent on data centres, servers and network infrastructure (capital expenditure) was $13.9bn, 3 times the depreciation charge. This has not always been the case.
The secular growth in capex from 1.3 times depreciation in 2014 to above 3 times depreciation in 2018 indicates to me that Facebook’s earnings quality is not what it once was. This is further evidenced by their depreciation charge falling from 33% of average fixed assets to 22%.
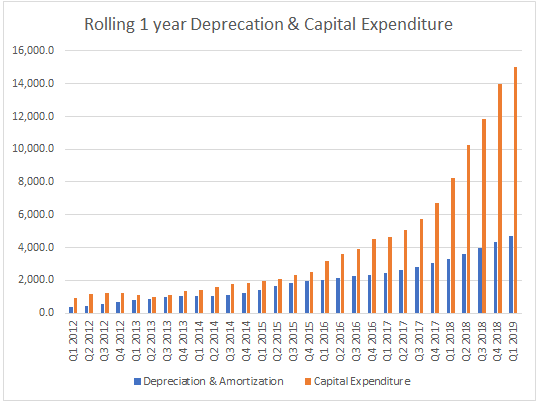
Source Bloomberg, Ranmore Fund Management
As the table below shows, if the income statements had been charged with capex not depreciation, operating income in 2018 would have been $15bn not $25bn, a decline of 7% rather than growth of 23% and an operating margin of 27% not 45%. Investors would view Facebook very differently.
Furthermore, in 2016 & 2017 free cash flow exceeded net income but in 2018 free cash flow was less and declined.
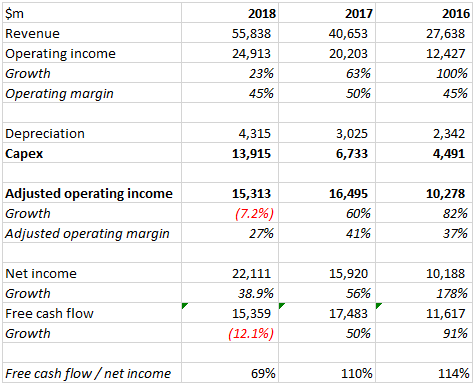
Source Facebook’s annual report (10k), Ranmore Fund Management
Bulls will argue that, “Facebook is investing for the future and it’s not prudent to make that adjustment.” The counter argument is that Facebook has always been investing for the future and yet the growth rate of capex has always been less than revenue growth. Last year, it was nearly 3 times the growth rate. Furthermore, all this capex means the depreciation expense in future years will rise and if revenue growth continues slowing, growing earnings will become more challenging.
I think free cash flow often provides a better insight into the quality of earnings than accounting earnings but with one additional adjustment – share-based compensation.
Share-based compensation is the income statement expense relating to share-based awards to employees, such as share options & Restricted Stock Units (RSUs). It is increasingly important because growth in employee numbers has exceeded revenue growth at some technology firms over the past year, crimping margins – Facebook’s employees have increased by 42% vs 32% revenue growth. Since companies don’t write out cheques for the cost of these share awards, this expense is considered a “non-cash” item and added back in free cash flow calculations.
Yet the cost to investors is the future earnings dilution from the additional shares in circulation, or if management is buying back vested shares from employees, a reduction in cash available for dividends.
In 2018, Facebook spent $12.9bn repurchasing 79m shares but their shares in issue only declined by 52m. The other 27m shares repurchased were from employees selling their RSUs or exercising share options. This suggests that Facebook spent $4.4bn buying back shares from employees, a cost that is 29% of their disclosed free cash flow.
If you are using free cash flow as your primary valuation methodology to calculate “true earnings,” it’s hard to argue against including a cost for share-based compensation when it is so substantial. Yet few companies or analysts do.
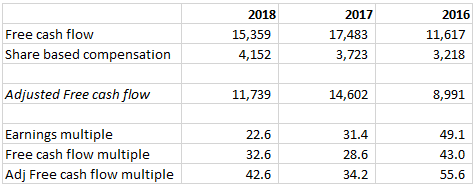
Source Facebook’s annual report (10k), Ranmore Fund Management
If you adjust free cash flow by the after-tax cost of shareholder compensation, Facebook’s “adjusted free cash flow” equals $12bn, nearly 50% less than their reported income.
As analysts, we now have to decide whether the multiple of earnings we are paying for Facebook is 23 times accounting earnings, 34x free cash flow (3% yield) or 43x free cash flow adjusted for share-based compensation.
If the true earnings of any business is the free cash generated after capital expenditure and paying its staff, I would argue that Facebook only generated $12bn last year. The market capitalisation of the company is $500bn, meaning that unless true earnings grow rapidly, it would take an investor 43 years to recoup their investment from cash flow.
But Facebook is not unique. The challenge of growing earnings against a backdrop of increasing depreciation & employee numbers together with rising stock-based compensation is commonplace among many of the high-flying technology companies. The concern for investors is that many of these names are among the largest holdings in ETFs and Actively managed funds today. If revenue growth continues slowing against a backdrop of these rising costs, earnings growth and share prices will suffer.
Technology companies may well be more expensive and riskier than many believe.
Sean Peche is the portfolio manager of the Ranmore Global Equity Fund which has no direct or indirect holdings or positions in any of the companies mentioned.