
Every week, the American Association of Individual Investors (AAII) survey their members asking one question, “I feel that the direction of the stock market over the next 6 months will be up (bullish), no change (neutral), or down (bearish)?”. The data is published every Thursday.
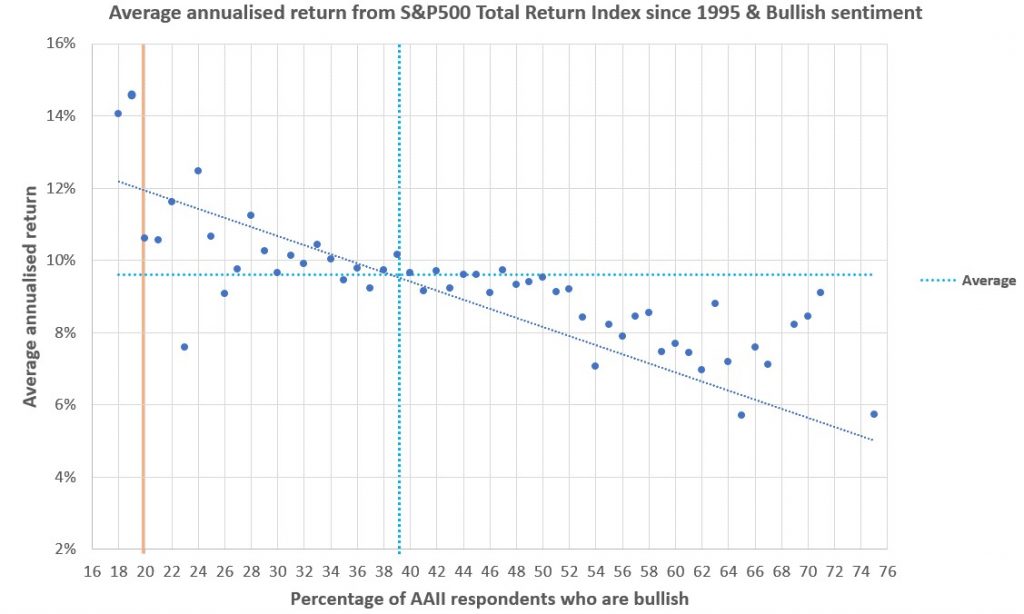
The chart below shows the average compound annual return from investing in the S&P500 Total Return index at the end of each week corresponding to each “bullish” survey result. Investing every week would have yielded an average return of 9.6% p/a since 1995 – horizontal dotted blue line and, on average, 39.5% of respondents answered “bullish” – vertical dotted blue line.
As the slope of the line of best fit shows, it has been a rather good contrarian indicator; especially at extremes. In general, returns would have been lower than average by investing when survey respondents were more bullish than average (to the right of the vertical dotted blue line). And returns would have been higher than average by investing when respondents were less bullish than average. As the chart suggests, the “price paid” for investing when it “felt comfortable” was in some cases less than half the return of investing when it would have felt extremely uncomfortable. Compound a 4%-5% return over many years, and the difference is substantial.
Although this seems counterintuitive, this strategy works because it is precisely when everyone is negative and selling that you get the opportunity to buy at low prices, which leads to higher subsequent returns. Conversely, buying at high prices when everything seems rosy leads to lower subsequent returns – it is simple maths.
It may also suggest how the average person has already acted and are positioned – if you’re bullish, you’re probably already fully invested, if you’re bearish, you’ve probably already sold. Therefore, if most people are bullish, there may be few remaining buyers, and if few people are bullish, it suggests there aren’t many sellers left. Any unexpected good / bad news and the market is likely to move sharply in the opposite direction to the consensus view,
But this shouldn’t be a surprise; Warren Buffett told us years ago to be ”greedy when others are fearful and fearful when others are greedy.” But while we all know the theory, amidst weak markets and heightened negativity, people start to think, “this time it’s different – the news flow and economic data is far worse than ever before.” It’s often not.
Last week, the S&P500 market fell by 1.2% within minutes of “weak” manufacturing data being announced – the ISM reading was 47.8 instead of the expected 50. But this fall wasn’t confined only to manufacturing related companies, the entire market fell. What does Google or Comcast manufacture? The following day, headlines flashed across the screen that ADP data showed private payrolls had increased by 135,000, less than the forecast 140,000. This caused the S&P to fall by a further 1.8%. Aside from the fact that employment still grew, we are talking about a difference of only 5,000 jobs in an economy that employs 156m people!
Together with the trade tariff and Brexit noise, these headlines have been enough to really scare the public, because last week only 20% of respondents thought the direction of the market would be up over the next six months. The vertical orange line on the far left of the chart shows how extreme this is. Indeed, of the 1,289 weeks in the analysis, fewer than 1% of observations have been this low or lower. Are conditions really this bad? The latest company earnings announcements of our Fund holdings don’t suggest so.
How can we make money out of this? Well, admittedly past patterns are no guarantee of future patterns, but this simple analysis of historic surveys suggests that if you’re going to worry about the news, use it to your favour and invest against the herd – do what the folksy billionaire told us to do, “be greedy when others are fearful”. Secondly, it may really help you to stay the course if you understand how your fund manager thinks and invests – do their fact sheets discuss their rationale for investing in companies or economics? And lastly, remind yourself of the chart above next time you are tempted to sell, simply because some 3 lettered economic acronym came in “below expectations.”
Ranmore Fund Management is authorised and regulated by the Financial Conduct Authority (FCA) .
The content of this promotion is directed in the UK to those persons who are Professional Clients or Eligible Counterparties (as defined by the FCA) and is provided for information purposes only. It does not constitute or form part of any offer to issue or sell, or any solicitation of any offer to subscribe or purchase, shares, units or other interests in investments referred to. Past performance is not necessarily an indication of future performance or returns.